By continuing, you agree to our use of cookies.
You’ve been assigned as the data holder for Cloud Computing, which covers the environmental impact of the company’s cloud infrastructure—such as services provided by AWS, Azure, or GCP.
Due to differences between providers, the method for retrieving and submitting this data varies by platform.
This section focuses on Infrastructure-as-a-Service (IaaS), rather than consumer-facing tools like websites, SharePoint, or Google Drive. The impact of these smaller-scale services is considered negligible and is excluded from this analysis.
This guide will help you correctly format and submit the data needed for the company’s impact assessment.
You’ll find the task in your to-do list here:
Following a 2025 update from AWS, all major cloud providers now offer native tools for exporting emissions data aligned to the GHG Protocol (Scope 1–3). This means you can access most of the information required by Alectro directly from your cloud platform.
Where to find your emissions data:
Microsoft Azure: Access the Carbon Optimization dashboard directly from the Azure Portal.
Google Cloud Platform (GCP): Use the Carbon Footprint tool, located within the Costs and Usage Management section of the console.
Amazon Web Services (AWS): View emissions details through the AWS Sustainability tool in the AWS console.
You can now access emissions data directly within the AWS Console, through their AWS Sustainability tool
In the AWS Console, navigate to AWS Sustainability. You can also find it quickly by searching “AWS Sustainability” in the top search bar.
In the left hand menu, click Reports and then click Download customised report
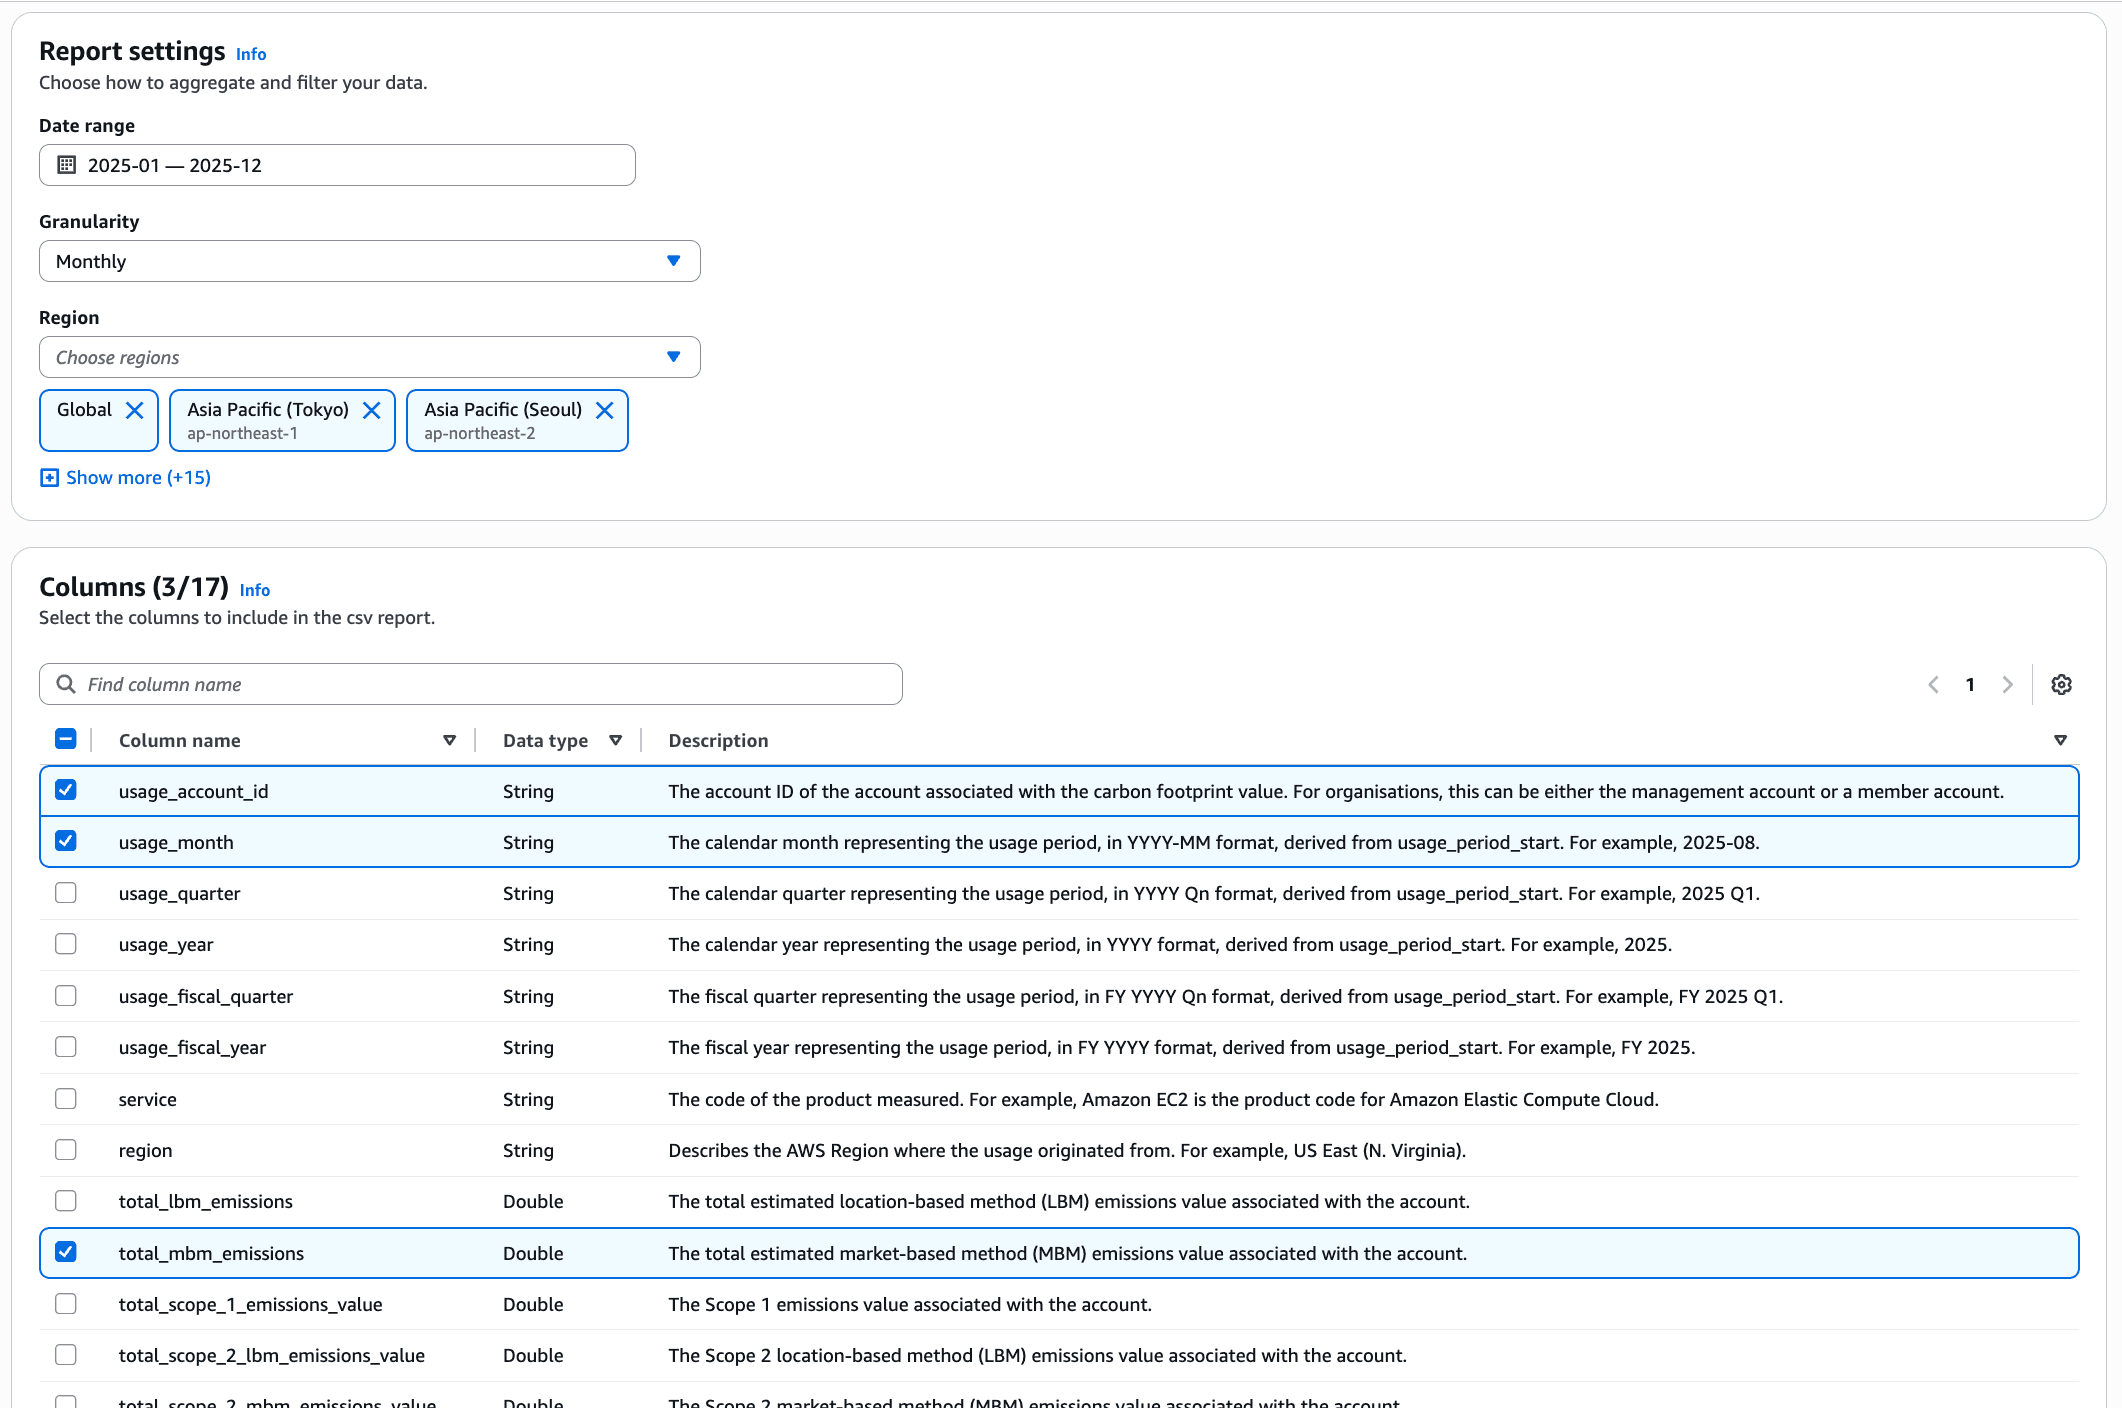
In the Report settings panel, select:
The correct Date range for your reporting period
Make sure Granularity is set to Monthly
And in Region, use the Select All checkbox
In the Columns panel, select:
usage_account_id
usage_month
total_mbm_emissions (it's important to select mbm, not lbm, to allow for low-carbon region purchasing to be factored in
Click Download to export your emissions file.
Once you've downloaded your data, you can copy and paste the data directly into the onboarding wizard, by selecting:
Cloud Provider: AWS
Location: the office location associated with the data (choose the main office if it's global)
Account Identifier: usage_account_id
Notes: Add any relevant notes required to the data
Alternatively, you can share the CSV with us by clicking the Upload Raw Data option, and we’ll process the data for you.
The Carbon Footprint dashboard displays estimated greenhouse gas emissions associated with the usage of covered Google Cloud services for the selected billing account. You can follow instructions to view and export the data from the dashboard.
You should export the data from the Market-based emissions tab: This tab displays emissions data broken down by scope 1, scope 2 market-based, and scope 3 GHG emissions.
Once you've downloaded your data, you can copy and paste the data directly into the onboarding wizard, by selecting:
Cloud Provider: GCP
Location: the office location associated with the data (choose the main office if it's global)
Account Identifier: the unique account reference in GCP
Notes: Add any relevant notes required to the data
Alternatively, share the CSV with us by clicking the Upload Raw Data option, and we’ll process the data for you.
You can export your emissions data in CSV format from the Emissions Trends page and the Emissions Details page in Azure carbon optimization in the Azure portal.
You can follow the instructions here: Export emissions data to a CSV file using the Azure portal - this will give us detailed information so we can get more accurate data on a monthly basis.
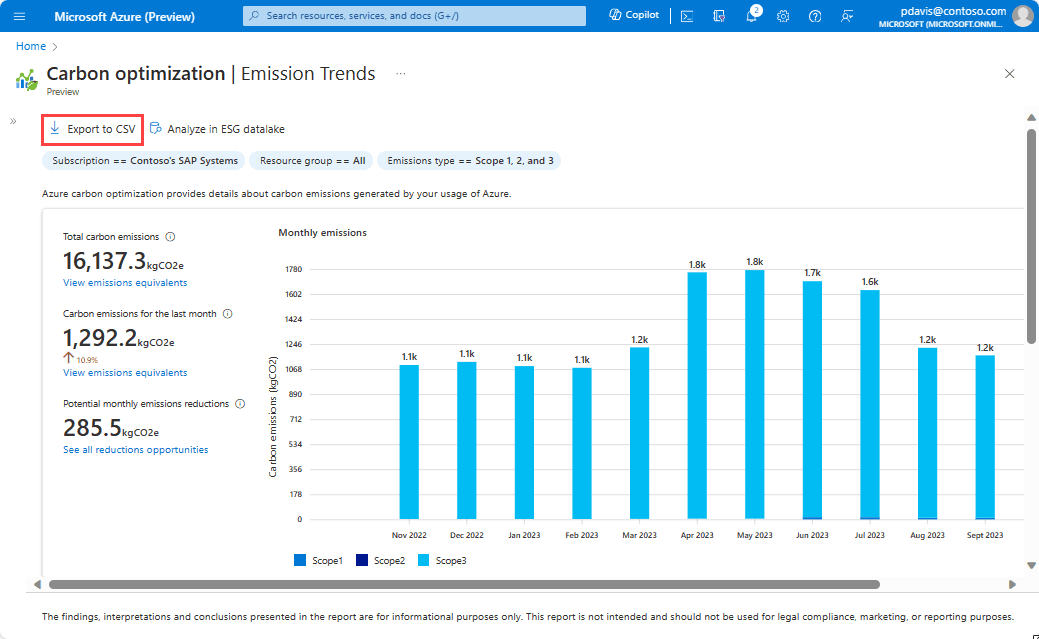
This will help you to download the Emissions Trends data for the last 12 months for the selected filters, including:
Scope 1, 2, 3 and total emissions
Carbon intensity
Please note that Azure reports emissions in kgCO2e, rather than tCO2e, so you will need to divide the downloaded values by 1000 before pasting in the values.
Once you've downloaded your data, you need to make sure the units are correct. At the time of writing, Azure exports data in kgCO2e, so you will need to make sure the data is in tCO2e. To do this, divide your values by 1000.
You can then copy and paste the data directly into the onboarding wizard by selecting:
Cloud Provider: Azure
Location: the office location associated with the data (choose the main office if it's global)
Account Identifier: the unique account reference in Azure
Notes: Add any relevant notes required to the data
Alternatively, share the CSV with us by clicking the Upload Raw Data option, and we’ll process the data for you.
If you're using a different cloud provider, please reach out, and we'll assist you in finding the most relevant information for your specific use case.
If you're unable to access the data, please reach out to us, and we will help arrange the best alternative solution.
If the data you download doesn't go back as far as the start of your reporting period, then we can extrapolate this for you. Simply upload the data you have via the Upload Raw Data option at the bottom of the page, and we'll get in touch if we have any questions.